Tilak Sharma
Bioinformatics analyst — computational drug discovery & reproducible omics pipelines
GitHub LinkedIn Email Methods write-up
I try to break a result before I report it. Every project below states its controls first — what the negative control was, where the leakage could hide, what the number looks like once you close that door. Usually the honest number is lower, and that is the point.
Selected work
inha-tb
Can a QSAR model trained on public InhA data pick new chemotypes — or is it just recognising analogues it has already seen?
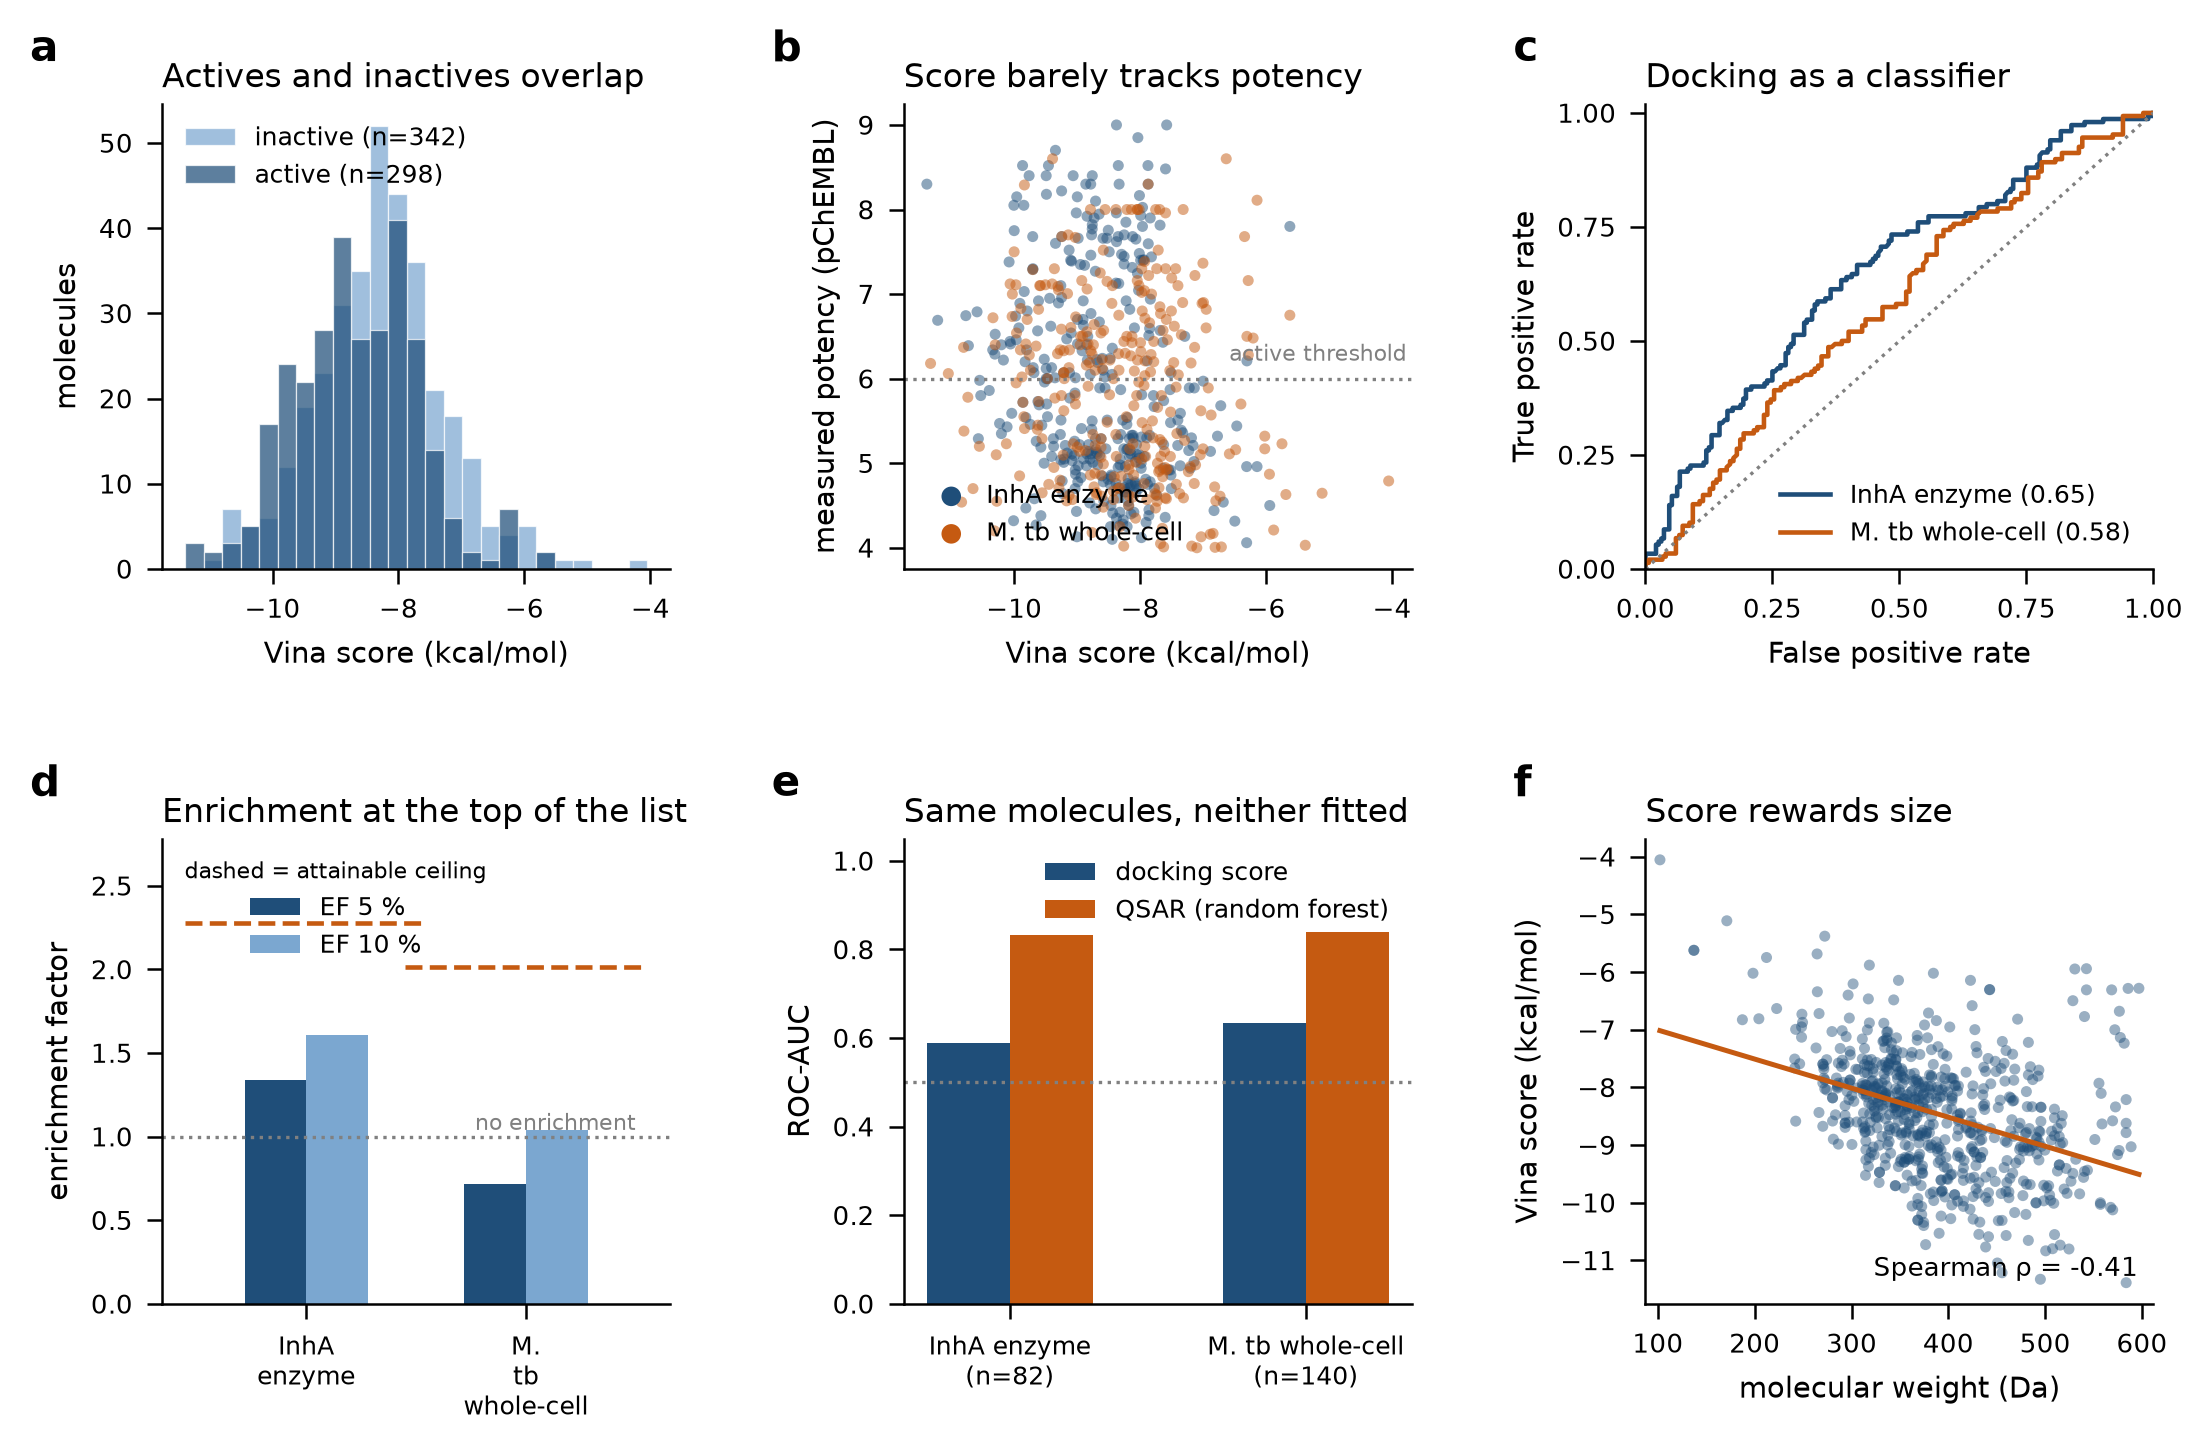
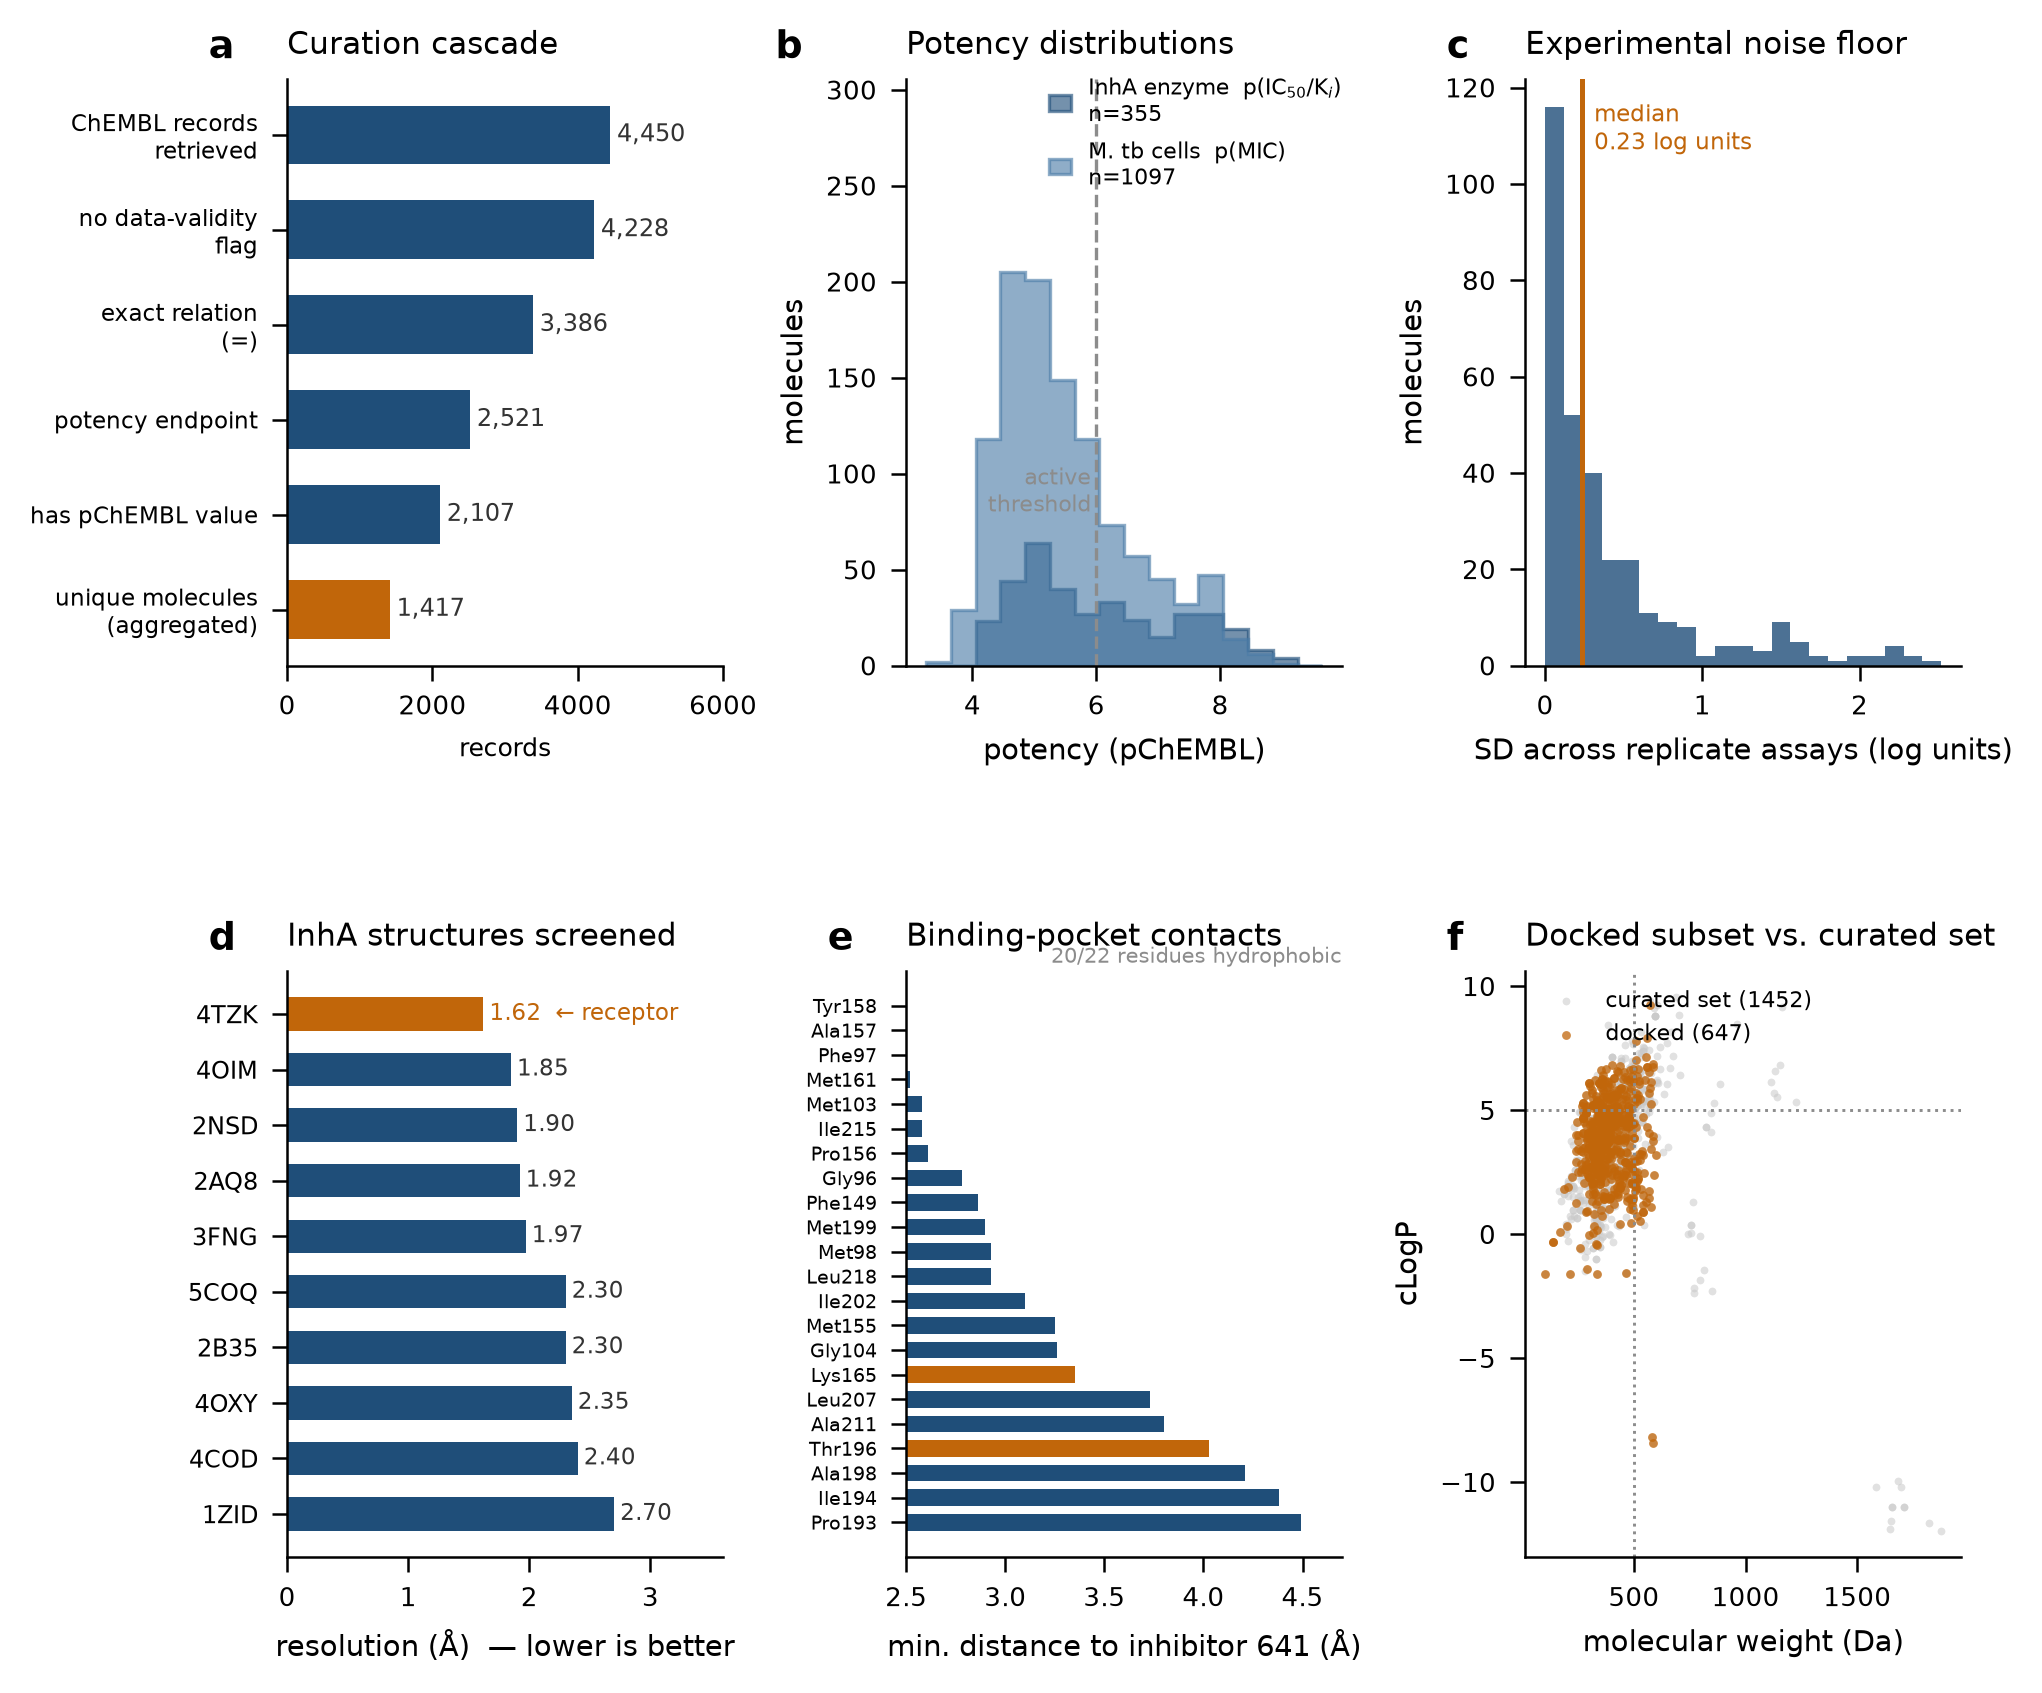
2107 curated bioactivity records, 1417 unique molecules, across the InhA enzyme and M. tuberculosis whole-cell assays. Three model families, two split strategies. Docking validated first by redocking the co-crystallised ligand into 4TZK — RMSD 0.23 Å — because a docking score means nothing if the pose protocol cannot reproduce a known pose.
| Held-out ROC-AUC | scaffold split | random split | inflation |
|---|---|---|---|
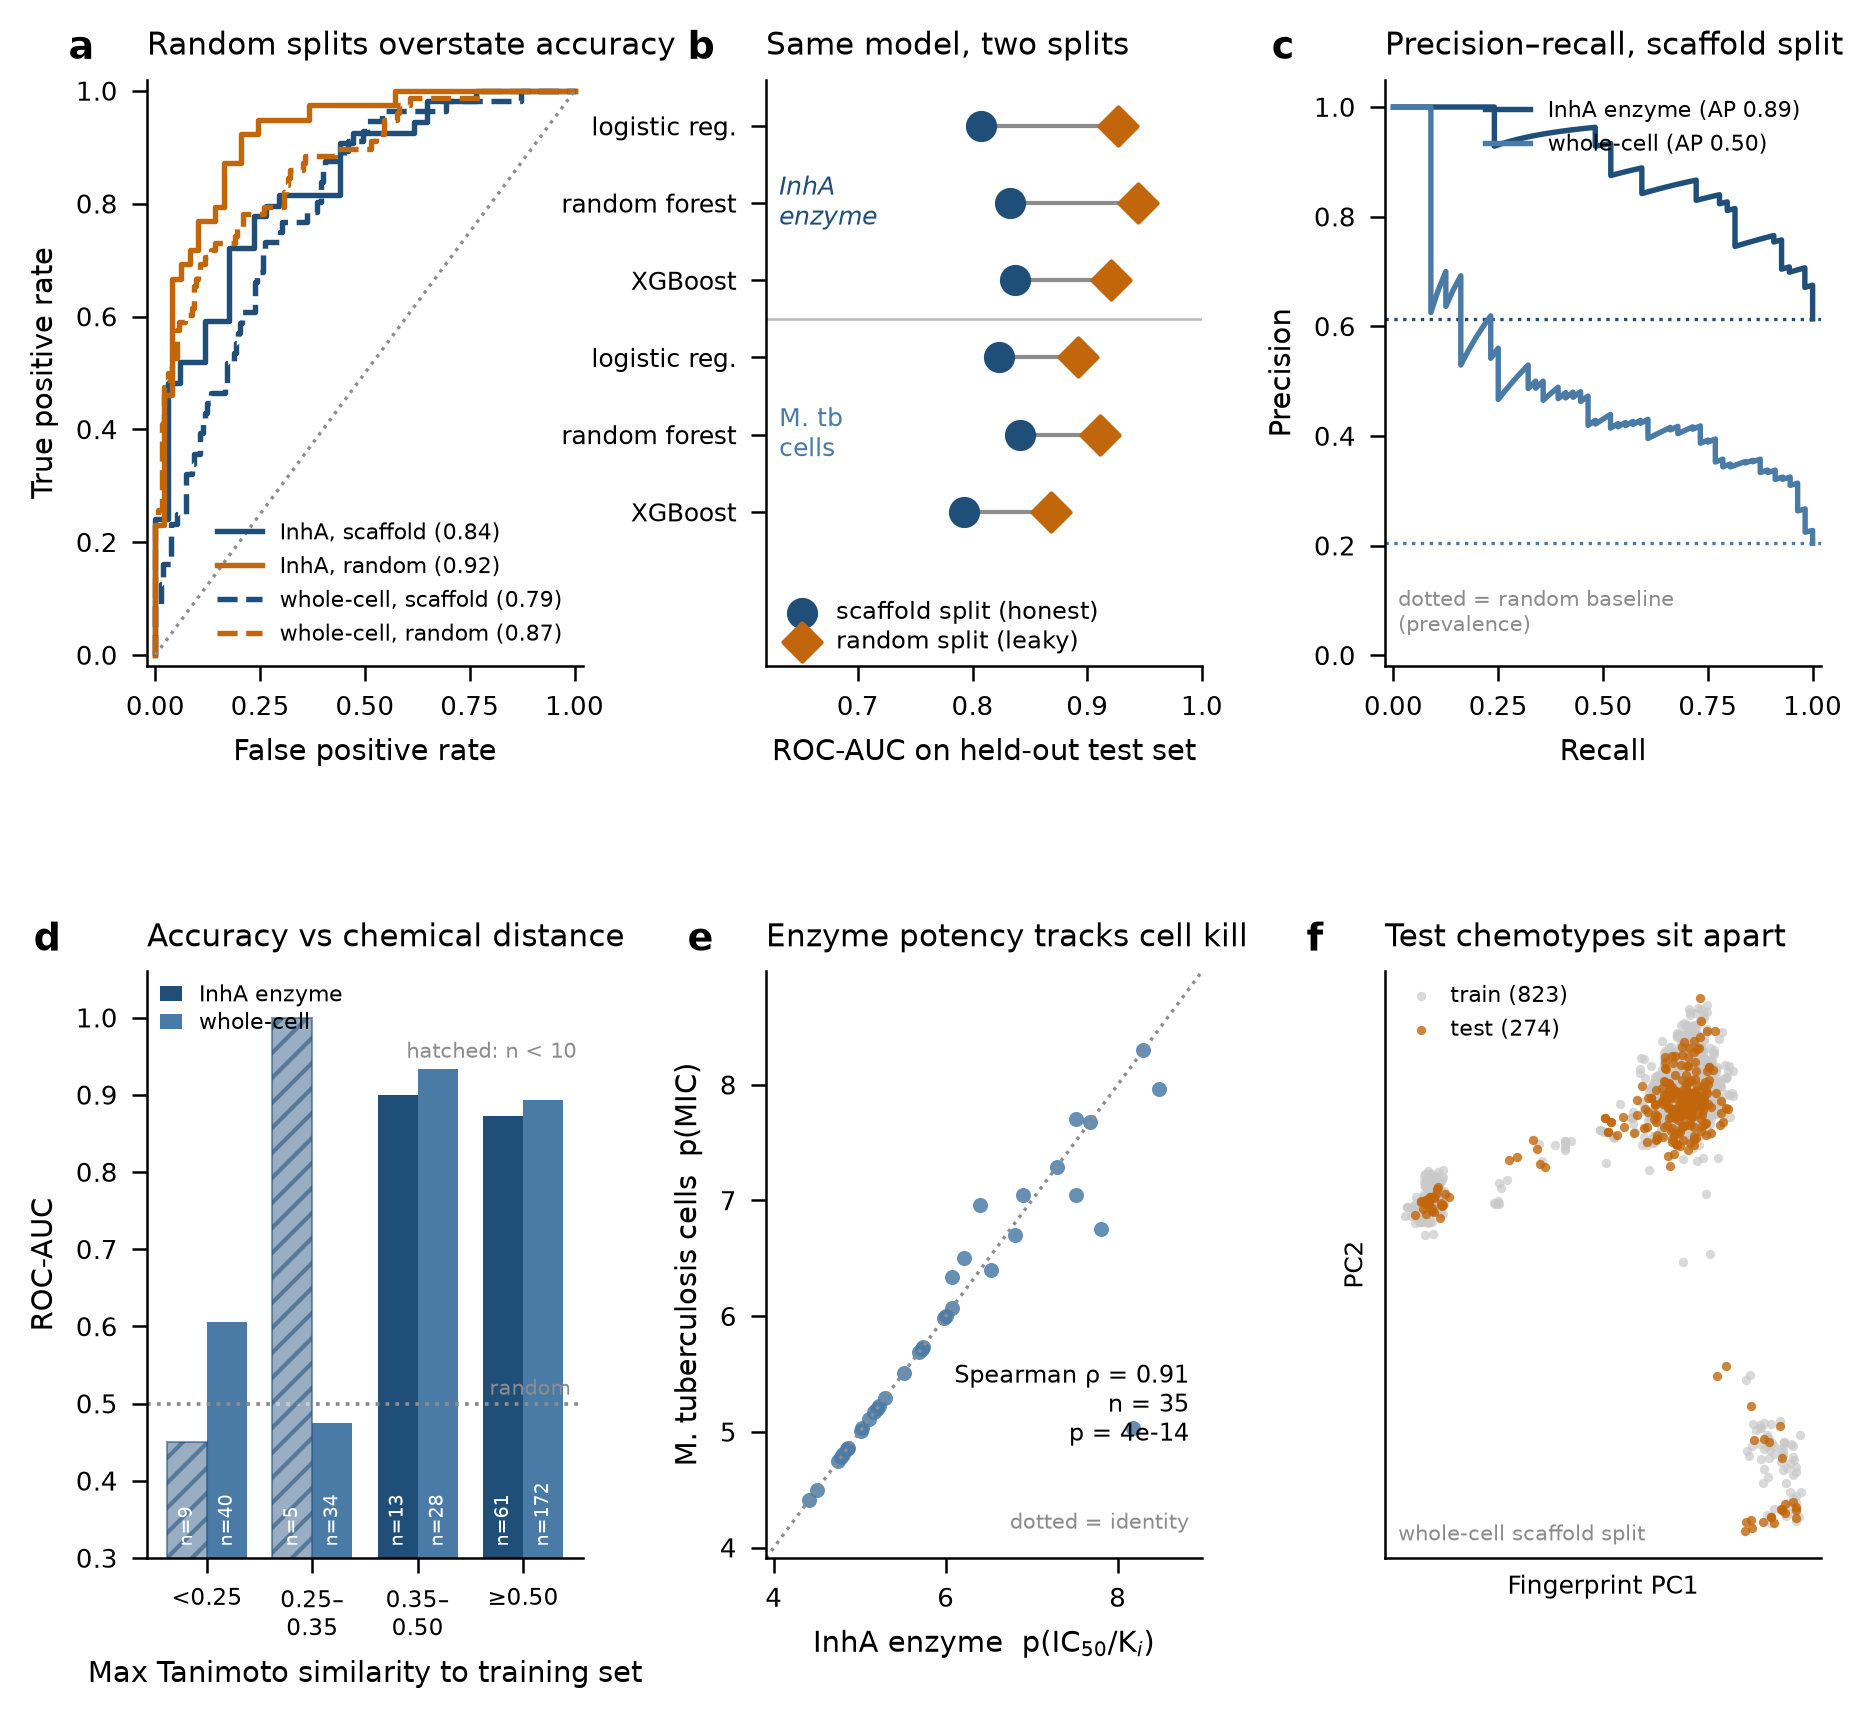
| InhA enzyme (XGBoost) | 0.837 | 0.921 | +0.084 |
| M. tb whole-cell (RF) | 0.841 | 0.911 | +0.07 |
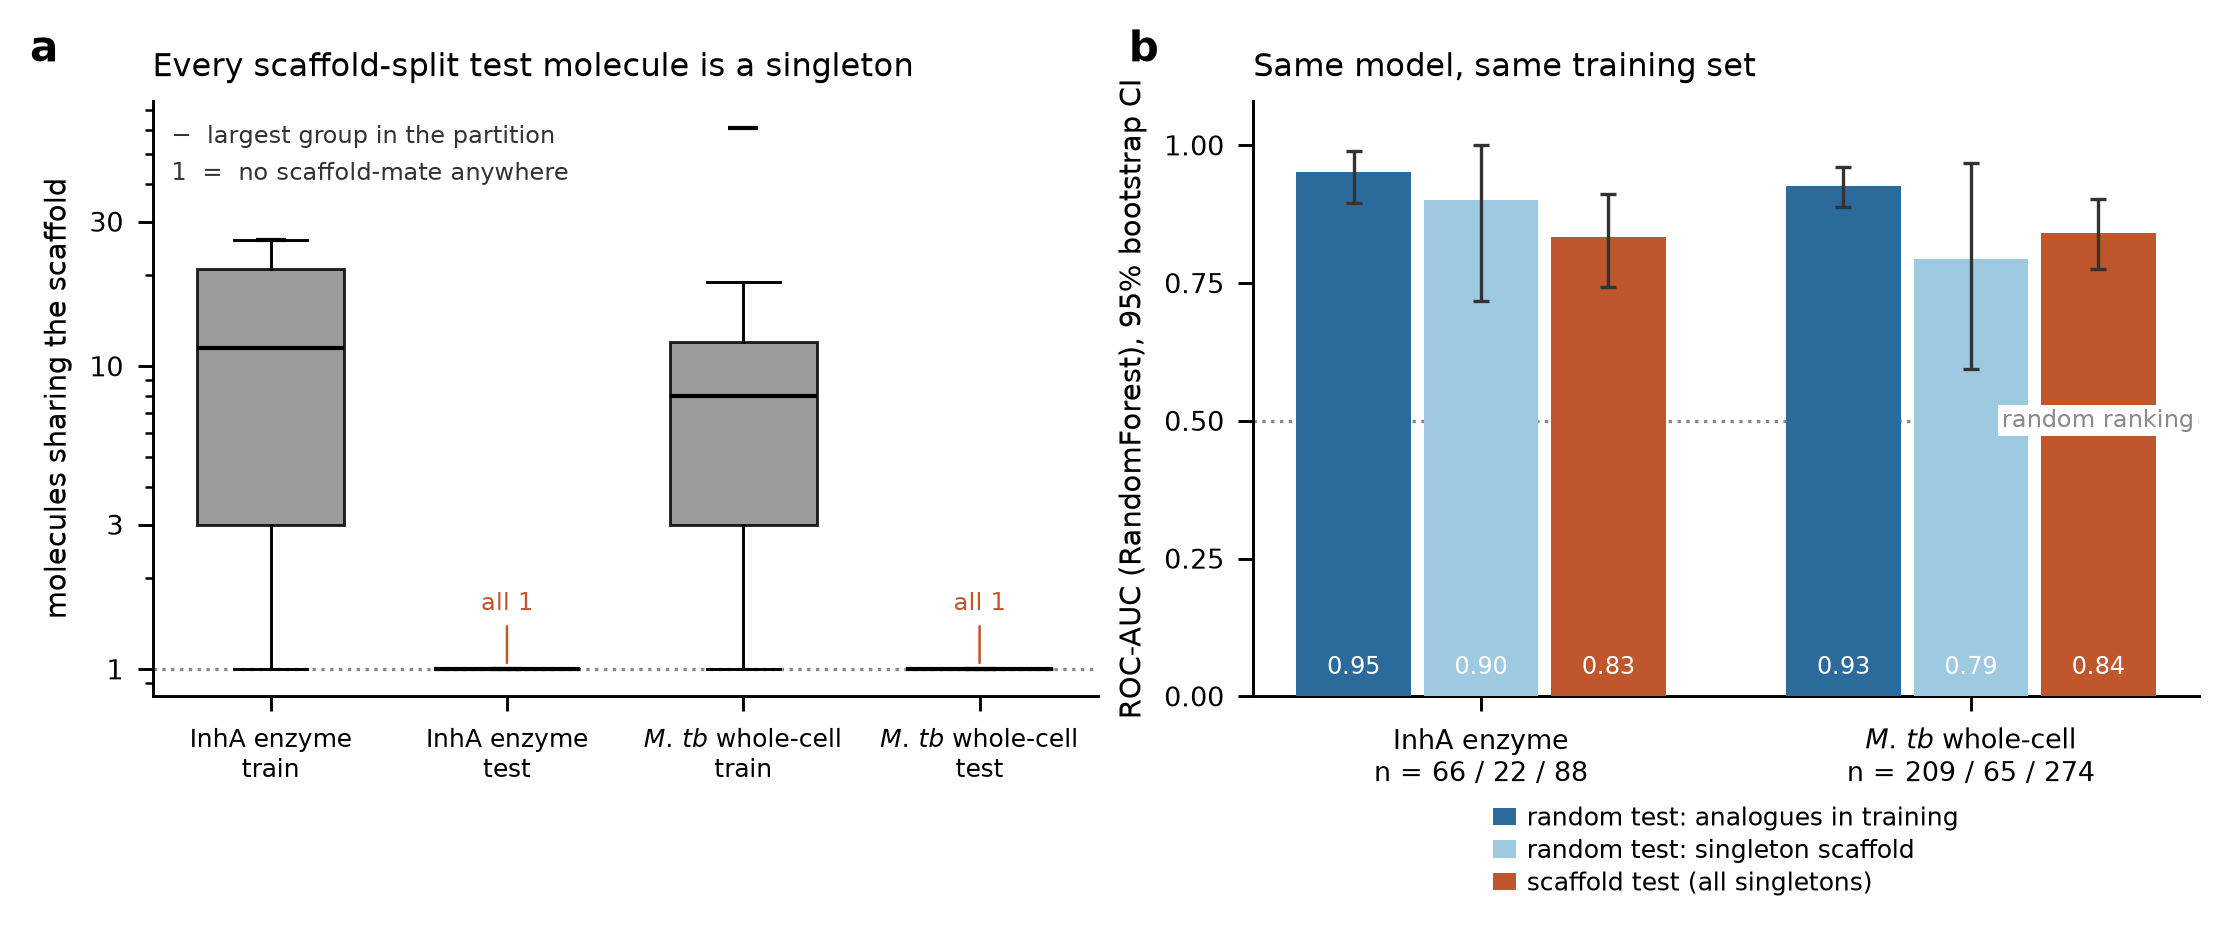
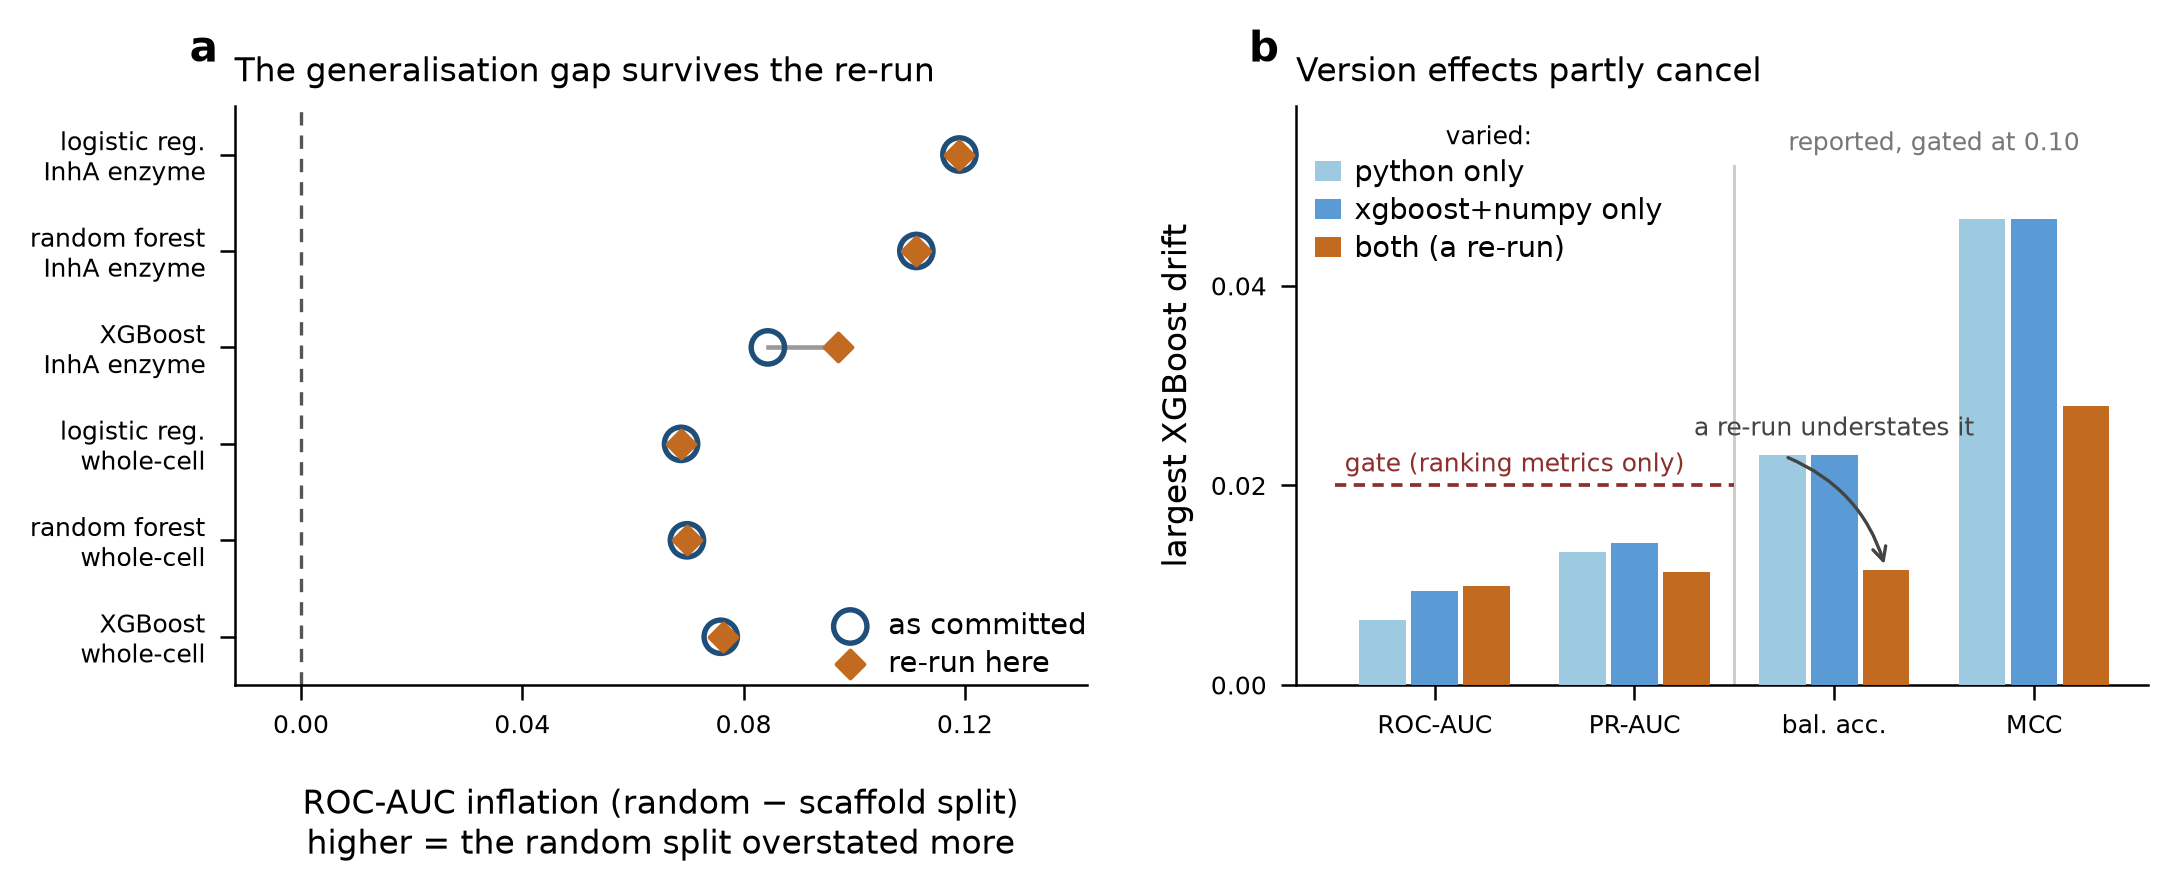
Across all six model×dataset combinations a random split overstates ROC-AUC by 0.069–0.119 (median 0.08). The cause is concrete: 29 and 89 Bemis–Murcko scaffolds appear on both sides of the random split. Every number quoted outside the full table is the scaffold-split one.
omics-ml-leakage-audit
How much does each cross-validation leak actually inflate a reported AUC?
Four protocols — leaky feature selection, sample-level splits on patient-clustered data, preprocessing before the split, and a clean nested pipeline — run over three tasks and three public lung-cancer cohorts. The point is not that leakage exists; it is the size of the effect, measured per protocol, so a reviewer can tell which shortcut costs what.
clinvar-vus-audit
How do variants of uncertain significance actually get resolved?
Two ClinVar releases 19 months apart, joined on variant identity, to measure which VUS move and in which direction. A reclassification rate is only interpretable against the denominator of variants that had the opportunity to move — so that denominator is constructed explicitly rather than assumed.
protein-domain-burden
Are pathogenic missense variants enriched inside annotated conserved domains?
ClinVar missense variants mapped onto InterPro domain boundaries. The enrichment is tested against a length-matched background, because domains are not a random slice of the protein and an unmatched comparison would find enrichment whether or not it is there.
nf-fastq-qc
A QC pipeline that fails loudly instead of producing a plausible-looking report.
Nextflow, nf-core conventions, 42 tests covering the failure modes that matter — truncated reads, mismatched pair counts, empty inputs — because a QC pipeline that silently passes bad data is worse than no pipeline.
Also on GitHub
rnaseq-de-GSE60450 · scRNAseq-PBMC-Analysis · 16s-amplicon-report · inha-ai-docking-benchmark · oss-contributions — upstream work on nf-core/tools and Galaxy training material.
Background
M.Sc. Botany. Research internship at Inha University (South Korea) on the computational TB work above. nf-core member. Based in Baran, Rajasthan, India (IST).
Every number on this page is generated from the source data in the linked
repositories — the inha-tb figures and table come from
docs/facts.json, which the analysis writes and the write-up reads. No number
here is typed by hand.